Click to jump to
Lung function tests
Lung function tests are an important assessment tool in the diagnosis and management of bronchiectasis. Lung function tests provide objective data about the type and degree of respiratory impairment.
Patterns seen in bronchiectasis
Airflow obstruction is the most common ventilatory pattern seen in bronchiectasis, though mixed obstructive/restrictive, restrictive or normal patterns can also be seen. The forced vital capacity (FVC) may be reduced, often in conjunction with an elevated Residual Volume (RV)/ Total Lung Capacity (TLC) ratio and normal to low TLC. Carbon monoxide transfer factor (TLCO) – a measure of gas exchange may be in the normal range – and it has been shown to be reduced in more severe disease. Exhaled nasal nitric oxide levels have been shown to be markedly reduced in those with cilial dysfunction (Pasteur et al 2010).
How often should lung function be assessed?
The British Thoracic Society Guideline for non-CF Bronchiectasis recommends that adults and school age children should have spirometry measured at initial assessment. They also recommend that adults attending specialist care have annual spirometry performed, and those with immune deficiency or primary ciliary dyskinesia have spirometry measured at least four times annually. Spirometry performed before and after antibiotic use may be of value in assessing improvements objectively. Measures of static lung volumes and gas exchange may be useful for identifying other causes of airflow limitation, and assessment of bronchodilator response may be useful for identifying those with reversible components to their airways disease (Pasteur et al 2010).
No recommendations for frequency for measuring nasal nitric oxide are made, though the main purpose of the test is to identify those requiring further investigation for primary ciliary dyskinesia.
Reactivity to inhaled hypertonic saline should be identified prior to considering commencing patients on inhaled hypertonic saline to assist mucociliary clearance, though no clear recommendation is given.
Aspects common to all tests
Reference values
All results are compared to reference values (normal ranges) that have been derived from large studies of lung function in people with good respiratory health (no evidence or history of respiratory disease) and generally little to no smoking history. Lung function has been shown to vary with gender, height, age, race and sometimes with weight in the normal population. There are many reference sets for parameters of respiratory function and it is important to keep in mind that the reference sets used may vary from laboratory to laboratory. Large global reference datasets are now being developed and published for use worldwide (Quanjer et al 2012, Stanojevic et al 2016).
Normal ranges
For test parameters where we are only interested in abnormally low results, we use a lower limit of normal (LLN). For parameters where we are only interested in abnormal high results, we use an upper limit of normal (ULN). For parameters of lung function where a result may be abnormally high or low, we set both upper and lower limits of normal. The limits are generally set so that 95% of the normal population sit within the normal range.
Interpretation
Interpretation of lung function is not discussed in detail on this website. For more detailed explanations and cases, see Pellegrino et al 2005 and Borg et al 2014.
The measured values from a lung function test are compared to the reference values to determine the pattern of impairment or normality. The measured values should also be compared to previous results to look for changes (improvements or decline) over time.
Spirometry
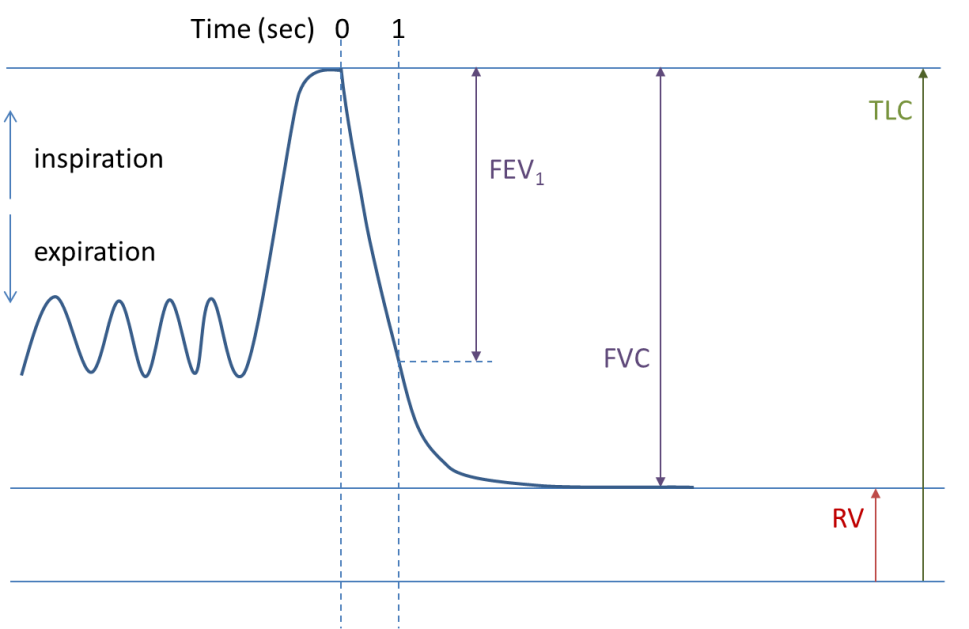
Spirometry is one of the more common tests of lung function. Forced spirometry manoeuvres measure how hard and fast a person can exhale from total lung capacity (TLC) to residual volume (RV) and sometimes, how hard and fast they can breathe back in to TLC again. The primary parameters of forced spirometry are the FEV1/FVC ratio, the FEV1 (forced expiratory volume in 1 second) and FVC.
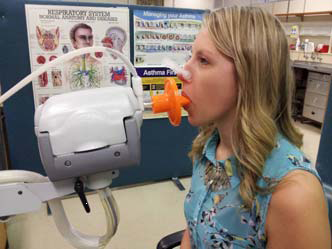
To measure spirometry, the patient commences tidal breathing on a mouthpiece, with nose peg in place to prevent leak. After a couple of tidal breaths, the patient is instructed to breathe in maximally until full and then exhale as hard and as fast as they can until they are very empty (Figs 1&2). The technique may differ slightly depending on the spirometer type being used and may include a maximal breath in to TLC at the end of the manoeuvre.
The vital capacity (VC), measured under relaxed conditions, is sometimes also measured. In health, the VC and FVC should be very close to each other. In those with significant airflow obstruction, there may be large differences between VC and FVC, with VC generally being larger than FVC.
Spirometry tells us about whether the ventilatory pattern is within the normal range or obstructed. Spirometry may also suggest potential restrictive or mixed restrictive/obstructive patterns, but measurements of static lung volumes are required to confirm these (Table 1).
Reversibility testing
Spirometry may be performed before and after the administration of a bronchodilator (most often a beta-2 agonist such as salbutamol) to assess for reversibility of airflow obstruction. A significant bronchodilator response is defined as an increase ≥ 12% AND ≥ 200mL in either FEV1 or FVC between pre-bronchodilator and post-bronchodilator tests (Pellegrino et al 2005). A significant bronchodilator response in a well-performed test suggests that there is a component of reversible obstruction that may respond to treatment.
Static lung volumes
Static lung volumes used in conjunction with spirometry help to better define ventilatory patterns when parameters fall outside of the normal range. The parameter total lung capacity (TLC) is used in 3 out of the 4 ventilatory pattern definitions (see Table 1). Total lung capacity cannot be measured using spirometry. This is because there is always a small amount of air left in the lung when we blow out until we are empty – the residual volume (RV) – which is included in TLC (See figure 1).
Table 1. Ventilatory patterns using spirometry and static lung volumes
| Ventilatory Pattern | Spirometry | Static Lung volumes | |
|---|---|---|---|
| Obstruction (3) | FEV1/(F)VC < LLN | ||
| Restriction (3) | FEV1/(F)VC > LLN | and | TLC < LLN |
| Mixed Obstruction/Restriction (3) | FEV1/(F)VC < LLN | and | TLC < LLN |
| Non Specific Ventilatory Pattern (5) | FEV1/(F)VC > LLN, FVC < LLN, FEV1 < LLN | and | TLC > LLN |
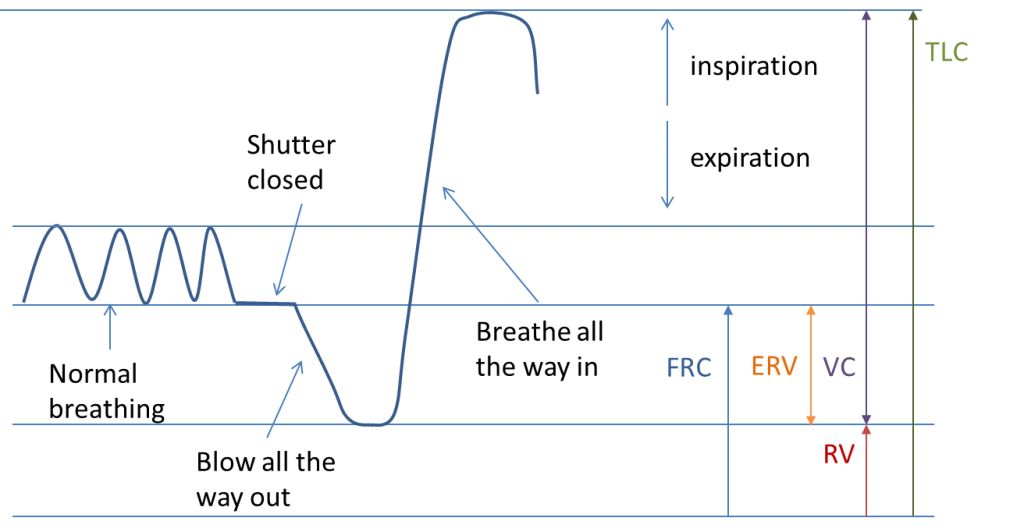
For simple classification of ventilatory patterns, TLC is the primary parameter of static lung volumes used. However, there are a number of other parameters that have been shown to be useful in defining the degree of obstruction when it’s identified on spirometry. They include: RV, functional residual capacity (FRC) and RV/TLC (see Table 2 and Figure 2).
| Spirometry | Static | Lung | Volumes | Possible Interpretation | |
|---|---|---|---|---|---|
| FEV1/(F)VC | RV/TLC | FRC | TLC | ||
| Decreased | Increased | Increased | No change | Obstruction with hyperinflation (FRC) | |
| Decreased | Increased | No change | No change | Obstruction with gas trapping | |
| Decreased | Increased | Increased | Increased | Obstruction with hyperinflation (TLC) |
Body Plethysmography
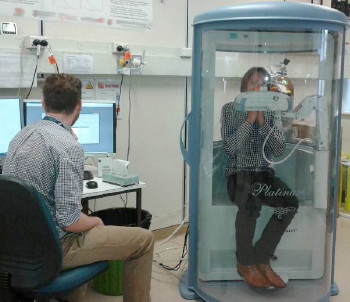
In body plethysmography, the subject sits in a box – a bit like a telephone booth (Fig 4). The box is sealed. After a short equilibration time, the subject is instructed by the operator to undertake a series of breathing manoeuvres on a mouthpiece. During the breathing manoeuvre, a shutter is closed in the mouthpiece and the subject continues to breathe (small pants) against the closed shutter. While the shutter is closed, the pressure at the mouth and the pressure in the box are measured. From this, the volume in the lung at can be determined (usually FRC). When the shutter opens, the subject blows all the way out until empty and then breathes in until full (Fig 3) so that RV and TLC can be determined.
Washout method
This technique washes out nitrogen (N2) from the lungs by breathing 100% O2. Basically, the volume at which the washout began (usually FRC) can be calculated by measuring the initial and final concentrations of N2 and the total volume exhaled. RV and TLC can then be calculated using a separate SVC manoeuvre (Wanger et al 2005). In health, it may take up to 7 mins to wash out N2 from the lungs. In obstructive disease, it may take even longer.
Dilution method
The dilution method consists of breathing a special gas mixture (consisting of O2 and N2 and an inert gas such as helium) of known volume and concentrations and looking for inert gas concentration equilibrium.
The volume in the lungs at the time the subject is switched into the breathing circuit (usually FRC) can be calculated using the initial and final inert gas concentrations and the system volume. Once the FRC is known, RV and TLC can be calculated from a separate SVC manoeuvre. For a more detailed explanation of the methodology and calculations see Wanger et al 2005. Like the washout method, waiting for equilibrium can take a long time (10 min), particularly in those with obstructive disease.
Limitations of test methods for measuring static lung volumes.
Each method for measuring static lung volumes has limitations. The plethysmographic method may overestimate static lung volumes in significant obstruction and the washout and dilution methods may underestimate lung volumes in significant obstruction.
Leak during the test will impact all methods of measuring static lung volumes, so if leak occurs, the test should be terminated and recommenced.
Single breath carbon monoxide transfer factor (TLCO)
The primary purpose of the lungs is gas exchange; to get oxygen into the blood and remove carbon dioxide from the blood. Spirometry and static lung volumes provide information regarding ventilatory function and the single breath carbon monoxide transfer factor (TLCO), provides information regarding gas exchange.
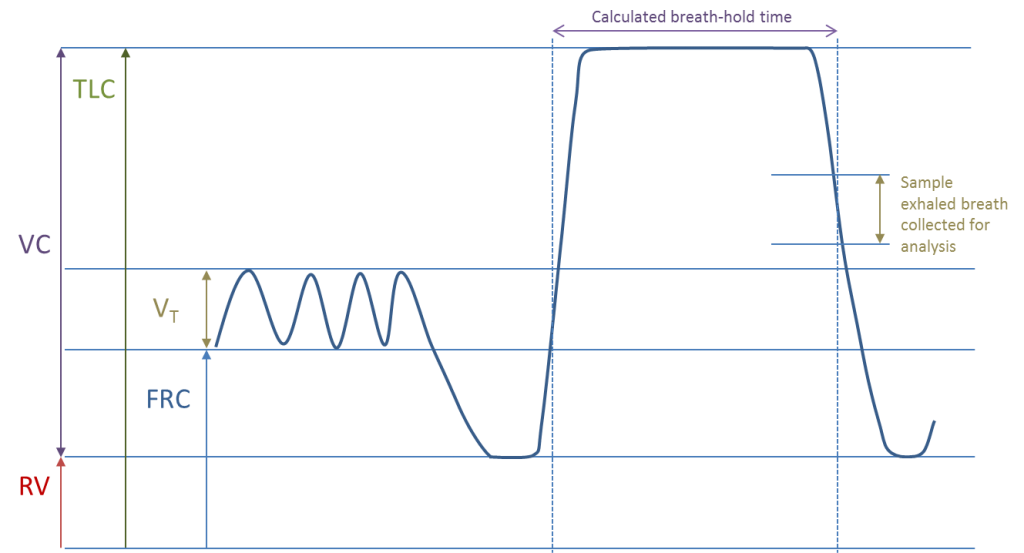
The test commences with the subject attaching to the mouthpiece with lips tightly sealed, and normal breathing with nose peg in place. After a few tidal breaths, the subject is asked to breathe out to residual volume and then breathe in a special gas mixture rapidly to TLC. Once at TLC, the subject breath holds for approximately 8 seconds before exhaling to RV again. During the final exhalation, the first portion of the exhaled breath is discarded (as dead space washout volume) and a sample is then collected for analysis (see Fig 5). The special gas mixture consists of nitrogen, oxygen, a very small amount of carbon monoxide and an inert gas (such as helium, methane or neon).
The initial and final concentrations of CO and the inert gas, along with the volume inspired and breath hold time during the manoeuvre are used to calculate the carbon monoxide transfer factor and the alveolar volume (VA), as well as other parameters of gas exchange. For a more detailed explanation of methodology and calculations see MacIntyre et al 2005 and Graham et al 2017.
There are a number of factors that can effect TLCO measurement (Table 3). Some of these factors can be accounted for by adhering strictly to test methodology and preparation. Others can be accounted for by applying corrections to measured values (MacIntyre et al 2005, Graham et al 2017 ). Table 4 shows some of the pathophysiological changes that result in either reductions or increases in TLCO.
| Decreased TLCO | Increased TLCO |
|---|---|
| Anaemia (low Hb, increased COHb) | Polycythemia |
| High PIO2 (supplemental O2) | Low PIO2 (test at altitude) |
| Hypercapnia | |
| Decreased pulmonary capillary blood volume (valsalva manoeuvre) | Increased pulmonary capillary blood volume (mueller manoeuvre, exercise) |
| Supine posture |
| Pathophysiological causes of reduced TLCO | Pathophysiological causes of increased TLCO |
|---|---|
| Reduction in alveolar membrane surface area e.g. emphysema, loss of lung units, incomplete alveolar expansion | Blood in alveolar spaces eg pulmonary haemorrhage |
| Alveolar membrane thickness increase e.g. pulmonary oedema, disorders of the interstitium | Changes in blood volume / distribution in the lungs e.g. asthma, obesity |
| Reduction in pulmonary capillary volume e.g. pulmonary hypertension, pulmonary embolus, microvascular destruction | Increased pulmonary capillary volume e.g. redistribution of blood flow following lung resection |
Exhaled nitric oxide (eNO)
Exhaled nitric oxide (eNO) can be measured as either alveolar or nasal nitric oxide (NO). The nasal NO may be of value in identifying patients who may require further investigation of their ciliary function. A low nasal NO level may indicate primary ciliary dyskinesia (Boon et al 2014). The technique for measuring exhaled nasal nitric oxide has become standardised in the past 10 years, though the standardised method for measuring nasal nitric oxide can be difficult to perform in young children of less than 5 years.
The technique for measuring nasal nitric oxide involves the sampling of the nasal passage via one nostril with air entrainment via the other nostril. Nasal ‘olives’ with sampling tubes are positioned in each nostril to ensure a leak free system. The velum should be closed to eliminate alveolar NO and this can be achieved by taking the measurement while the subject exhales against a resistance to generate a pressure of about 10 cmH2O. Ideally, air entrained into nasal cavity should be NO free, hence air is entrained via an NO scrubber. The measurement is minimally invasive, and each measurement takes approximately 10-20 seconds to make.
6% hypertonic saline assessment
Hypertonic saline (6%) may have some value in assisting mucociliary clearance in individuals with bronchiectasis (Nicolson et al 2012). Hypertonic saline has also been shown to cause bronchoconstriction in those with currently active asthma and therefore it is important that safety is assessed prior to commencement of hypertonic saline as part of therapy.
There is no standardised procedure for assessing safety of hypertonic saline, but assessment generally consists of the following steps:
- Review of recent clinical history
Ideally subject should be clinically stable for 4 weeks prior to assessment.
No admission to hospital within previous 4 weeks
No increase in respiratory medications or antibiotics in previous 4 weeks.
- Baseline spirometry is measured
- A short-acting bronchodilator is administered
- Post bronchodilator spirometry is measured after waiting an appropriate time for bronchodilator onset of action
- Results are reviewed for the following:
Spirometry is compared to previous 6 months and should be within 10% of best
The response to inhaled bronchodilator should be non-significant (see Reversibility testing)
FEV1 >1.00L
The referring doctor should be consulted if any of the conditions above are not met prior to proceeding, to determine safety to continue.
6.Hypertonic saline is inhaled via nebuliser (preferably the one the subject will be using at home) for 10 minutes, followed by a 20 minute rest
7.Spirometry is repeated. If FEV1 falls >15% from baseline FEV1 (pre-bronchodilator), this indicates that airways are reactive to hypertonic saline and this therapy may pose a safety risk in the individual.